Pages

Tuesday, December 25, 2018

$SPX - Big Picture Looks Positive

SPX has seen a 20% drop which does meet the minimum definition of a bear market.  Ironically just as the bear market has begun, a large bounce is coming next.

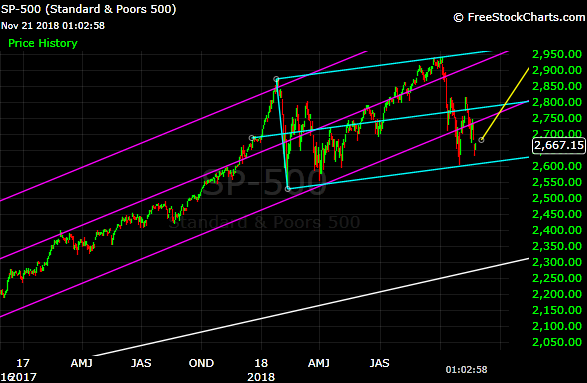
Weekly SPX is oversold now, much more so than in February, and that likely suggests the bounce will be fast.  SPX is testing the weekly 200 moving average which notably is rising.

People will need to adjust to a larger, faster paced market looking forward.

Weekly


Notice VIX lower high from February.  Recent VIX pop confirms SPX is bottoming now.

Weekly

Thursday, December 20, 2018

$SPX - Downside Target

Selling appears to be nearing exhaustion.  The measured downside target has almost been reached.  The December leg down is likely to be at least as long as the October leg down.  Possibly a little deeper.  

Blue support is to be tested soon.  A strong bounce into January is likely from the low that is forming.

Daily

Wednesday, December 19, 2018

UVXY - Inverse Head and Shoulders

A spike up in UVXY may be imminent.  An inverse head and shoulders pattern has formed, and price is pressing hard on the neckline.

Breakout may occur soon.

Daily


Tuesday, December 18, 2018

$SPX - Short Term Levels to Watch

SPX looks to be forming a low in December, and likely to make a bounce into January.  A support is currently being tested.

Although prices may see lower yet with a potential test of the blue support, timing is coming due for a low and pop into January.  Weekly charts are close to turning up which means a month long pop is coming soon.

Daily

Monday, December 17, 2018

$SPX - Long Term Resistance!

SPX has turned lower off quarterly resistance.  The chart shows a relatively expensive market.  Thus a mild bear market is possibly beginning.  If that is the case, then SPX may lose all gains since 2016 as shown with a measured decline.

SPX has had a great run, but may be ready to retrace some of the gains.

Quarterly


Monday, December 3, 2018

SPX - Measured Move Target

SPX has risen to test resistance as anticipated.  Consolidation or minor dip at this level is to be expected.

The meltup is likely to continue soon.  A measured move target is shown, with heavy resistance in red.

30min Chart

Friday, November 30, 2018

SPX - Short Term Support/Resistance with 2,975 Target

SPX warmed up this week, and it is just the beginning.  Minor resistance is overheard with support building at the 2,700 level.

30min Chart


Ultimately, SPX is moving towards a price target of 2,975.  The channel is clearly defined with a shallow slope that is sustainable.

Daily


Wednesday, November 21, 2018

$SPX - Weekly signals Big Bounce Ahead

SPX was unable to maintain rising in the steep slope of the main pink channel.  Another channel has formed, and the slope is gradual.  Outlook for SPX remains positive as price will likely rise in the blue channel next.

The weekly chart of SPX is signalling a big bounce ahead.

Daily Chart

Sunday, November 18, 2018

Bitcoin - Before/After

Bitcoin has declined off the white trendline identified in July.  Price is approaching the target area.

A bounce is possible short term, but lower prices are likely ahead.  Price action is consuming time, and the bottom may not form until next year.

Daily


July 16, 2018:

Daily


Thursday, October 11, 2018

$SPX - Deep Pullback Confirmed

The deep pullback scenario played out and price is approaching the main support.  The 2,750 deep pullback target was reached today.  An underthrow is possible though.


Upside is becoming quite attractive to the magical 3,000 SPX target, and we would expect that in approximately 6 months. 


The weak bull market continues with the main channel intact.


Daily Chart

Tuesday, October 9, 2018

$SPX - Head and Shoulders

SPX appears to be forming a nice example of a head and shoulders pattern.  The Left shoulder and Head are complete with the Right shoulder next. 


Price held the neckline firmly today.


60min Chart

Monday, October 1, 2018

$SPX - Pullback Next

SPX has rallied on trade deal news.  Prices may be overextended short term though, and a possible pullback to test white trendline support may be coming next.


The pullback may be similar in size to the June decline.


Daily

Tuesday, September 11, 2018

$SPX - Run to the Top!

SPX is in the sweet spot with the run to the top apparently underway. 


Mid-channel resistance has become support which has opened the door to further upside.  A steady meltup is likely ahead.


Daily Chart

Wednesday, July 25, 2018

$SPX - Before and After with 2018 Target

SPX has reached the Cycle target identified in May, 2018 analysis.  Both charts are shown with the results before and after.

A small pullback is due in August followed by the final run to the 2018 target. 

Daily


Before:

May 21, 2018 analysis:  Breakout!

Daily


Monday, July 16, 2018

Bitcoin - Bouncing but Capitulation is Coming

Bitcoin is making another bounce off support, but the bounces are becoming smaller and price is weak with a sideway move.

Capitulation is likely to occur later this year.

Daily


Monday, July 2, 2018

SVXY - Rejected off Horizontal Resistance

SVXY has declined from the band of horizontal resistance identified May 10, 2018.  Notice the interaction with the red resistance lines.

A low is due to form shortly.

60min Chart


Monday, May 21, 2018

SPX - Breakout - Whipsaw Phase to Intensify

SPX found strong support as expected and has rallied up to test the white trendline identified in April. 

SPX is breaking out.  However, the whipsaw phase is about to intensify.    

SPX Daily


Before:

April 2, 2018

"SPX is approaching long term channel support and testing the 50 weekly moving average at 2,565.  Expect a big bounce soon as least up to channel resistance as identified."

30min Chart


Thursday, May 10, 2018

SVXY - Before/After - Target Achieved!

SVXY has established the trading range as anticipated, and the target identified March 22, 2018 has been achieved today.

A band of horizontal resistance is shown. 

60min Chart


Before:

March 22, 2018 analysis:

"SVXY is declining towards short term support.  A trading range has established in the $11 to $13 range, and that is expected to continue into May."

30min Chart


Monday, April 2, 2018

$SPX - Channel Support and Resistance

SPX is approaching long term channel support and testing the 50 weekly moving average at 2,565.  Expect a big bounce soon as least up to channel resistance as identified.

30min Chart

Saturday, March 31, 2018

Bitcoin - Capitulation Soon

Bitcoin is flirting with a breakdown below support.  The decline that began in December is nearly complete.

Capitulation is likely to occur soon with a lower low than February.

Daily Bitcoin

Thursday, March 22, 2018

SVXY - Short Term Targets

SVXY is declining towards short term support.  A trading range has established in the $11 to $13 range, and that is expected to continue into May.

Overhead horizontal resistance has been identified.

30min Chart

Thursday, March 8, 2018

SPX - Calm Seas and Smooth Sailing Ahead

SPX has likely completed the volatile first leg down, and calmer markets are ahead in March and April.   

The SPX model shows a slow and steady grind up next.  Dips should be relatively minor as the model predicts a relentless grind higher.  The next several weeks look relatively flat as SPX builds a solid base.

60min Chart


SPX 2018 Model:


Thursday, February 15, 2018

SVXY - Initiating Coverage

As expected the parabolic rise in XIV identified early in 2017 collapsed with a bottomless decline.  The fund will be delisted on February 20, 2018.  The END.

Similarly, SVXY has fallen from grace.  SVXY has backtested fork support exactly.  Longterm trendline resistance is located at approximately $19.  

Weekly Chart


Thursday, February 8, 2018

$SPX - Rollercoaster Ride to Continue - Massive Rally Approaching

SPX plunged off major resistance this week.  However, the channel is intact, and still mildly bullish.  A new slightly higher high is likely to materialize according to the model.  

The model shows that the topping process will be characterized by whipsaws and chop.   

Daily Chart


Wednesday, February 7, 2018

UVXY - Measured Move Achieved - Volatility to Continue!

The measured move targeted in January 9th analysis has been achieved.  Price touched the orange fork resistance exactly and was rejected.

The markets have entered the whipsaw phase. 

UVXY should decline next week into Friday, and spike again to test the orange resistance later this month.  Volatility to continue, and increase in the following months.

2day Chart


Before:

January 9th, 2018 analysis:

"Not much room for downside on this chart for UVXY.  Price slowly grinding along support with time.  Spike up likely within a few weeks."

2day Chart


Thursday, February 1, 2018

XIV - Decline has Commenced - Update

XIV plunged and came close to the initial downside target, and has bounced back to the orange trendline. 

Notice that XIV bounced at the blue trendline from August.  XIV is extremely weak and the blue trendline will not hold.   

The orange line may provide resistance or XIV may be able to overshoot it.  In any case the largest plunge is yet to come... 

2day Chart


Before:


This model shows similarity to XIV.  Notice the sudden drop with no warning, and continuation lower:


Tuesday, January 9, 2018

XIV - Reversion to the Mean

Mean reversion is the theory suggesting that prices and returns eventually move back toward the mean or average.

XIV has overheated and a reversion to the mean is likely in the months ahead. 

When prices become this stretched from the normal, the move tends to be quite violent with a panic decline.

2day Chart


This model shows similarity to XIV.  Notice the sudden drop with no warning, and continuation lower:


Not much room for downside on this chart for UVXY.  Price slowly grinding along support with time.  Spike up likely within a few weeks.

2day Chart